On this page
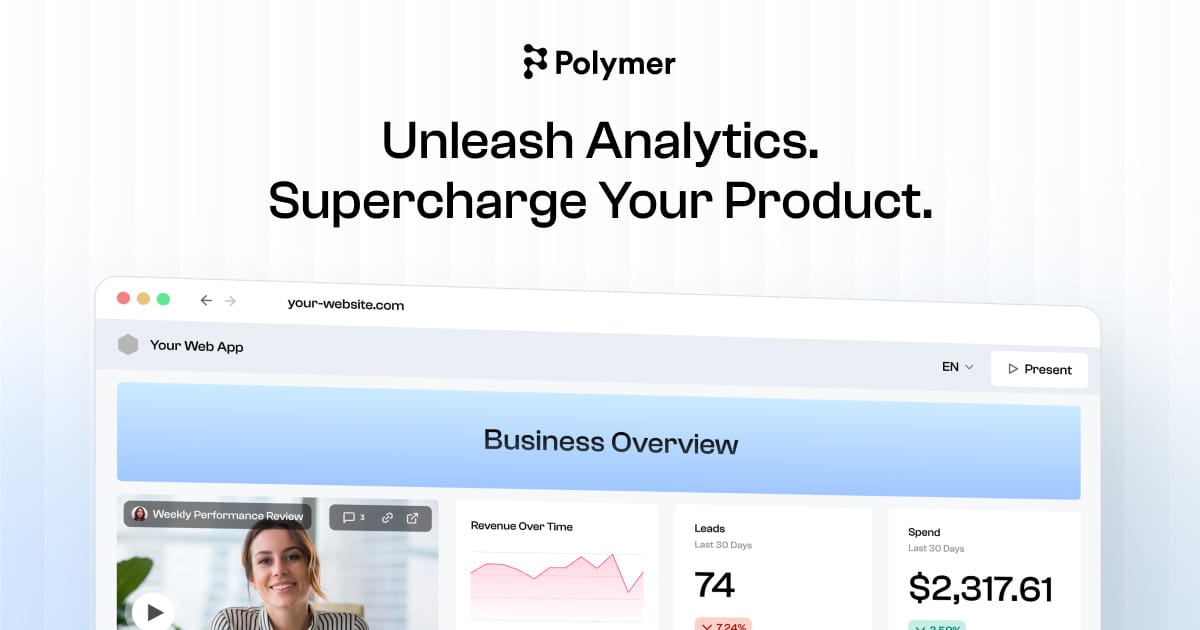
Polymer Search connects a spreadsheet, CSV, or a source like Google Sheets and automatically builds an interactive dashboard on top of it — charts, filters, pivot-style views, and an explorer — without any modeling or query writing. Its AI reads the columns, suggests visualizations, and answers plain-language questions about the data, so a non-analyst can get from a raw export to a shareable view quickly.
Against heavyweight BI tools like Tableau or Power BI, Polymer trades depth and governance for speed and simplicity: there is no semantic layer or complex data pipeline to maintain, which suits marketers, e-commerce operators, and small teams more than enterprise analytics groups. It is often used to explore ad, sales, or CRM exports and to hand clients an embeddable dashboard without building one from scratch.
Key Features
- Automatic dashboard and chart generation from a spreadsheet
- Connections for CSV, Google Sheets, and similar sources
- Natural-language questions answered against your data
- Interactive filtering and pivot-style exploration
- Embeddable and shareable dashboards for clients or stakeholders
- No SQL or data modeling required
Pricing
- Free / trial: Try the builder on a limited number of datasets
- Paid plans (roughly $20-$60/month and up): More datasets, larger row limits, refreshes, and team sharing
- Higher tiers: Additional connectors, seats, and embedding options
Exact tier names and limits change, so check the current plan page before committing.
Best For
Marketers, e-commerce and operations teams, freelancers, and small businesses that live in spreadsheets and want quick, shareable dashboards without hiring an analyst or standing up a full BI stack.
Limitations
It is built for spreadsheet-scale data and light exploration, not enterprise-grade modeling, governance, or very large warehouses — teams that need those will outgrow it and prefer Tableau or Power BI. Because it infers structure from your columns, messy or inconsistent data needs cleanup first. Pricing and limits shift over time, so treat the numbers above as approximate.